FT-IR-Spektrum
FTIR bzw. Fourier-Transformations-Infrarotspektrometrie
Rohspektren[Bearbeiten]
Die Spektren sind als erste Versuche anzusehen.
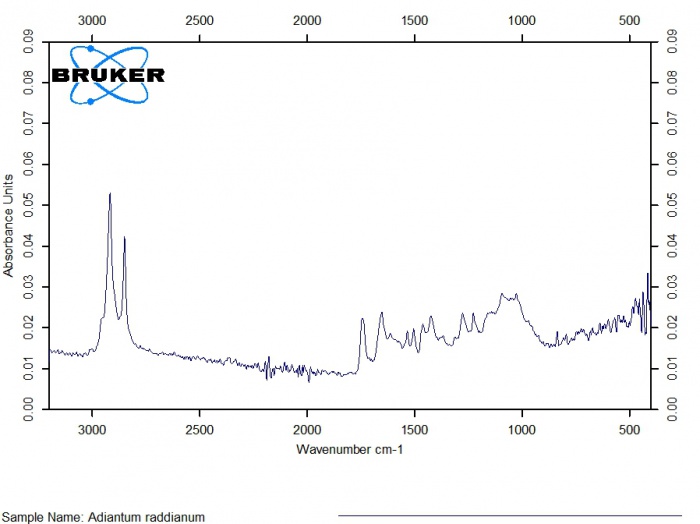
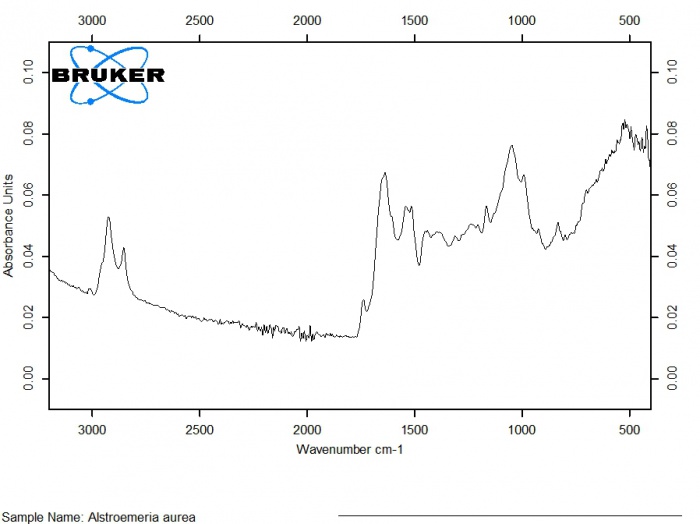
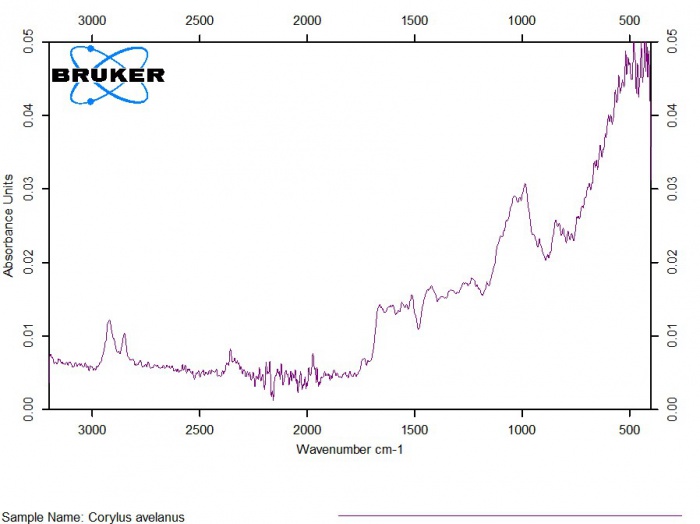
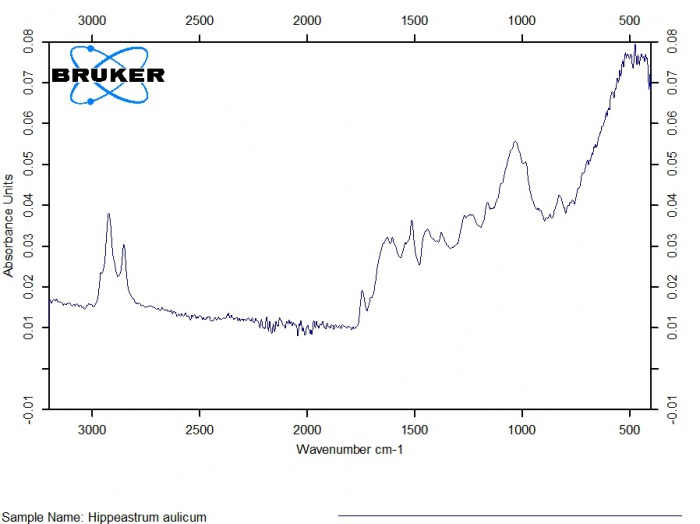
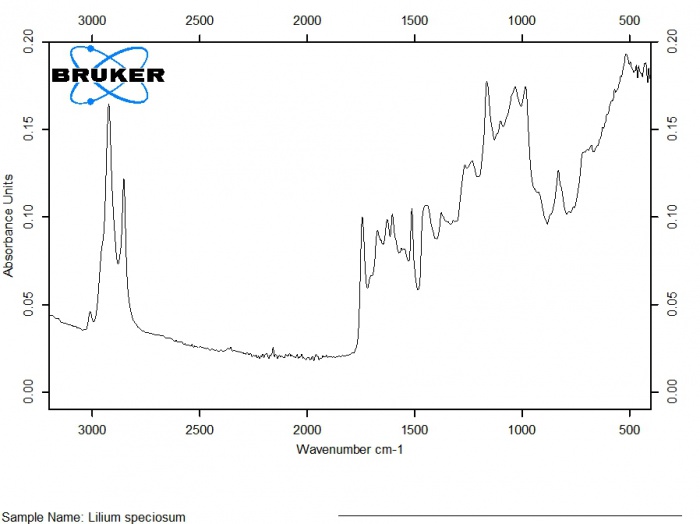
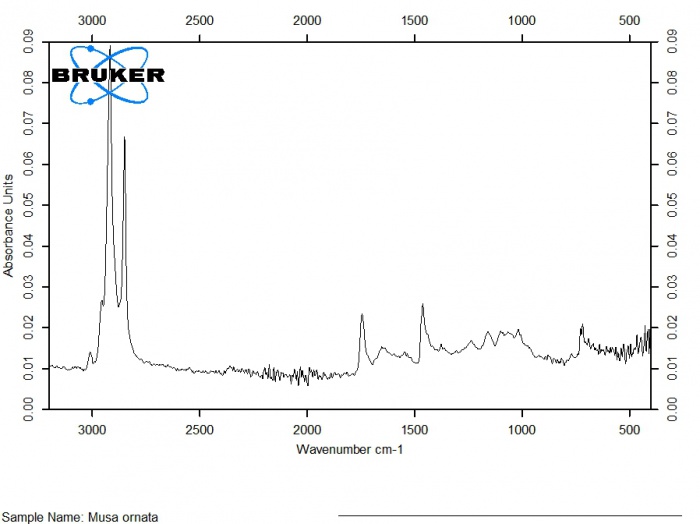
Unbehandelte Pollenproben. Aufgenommen mit einem Bruker FT-IR Spektrometer Alpha P, 24 Scans pro Spektrum, Wellenzahl 300 bis 4000 cm-1.
| FT-IR Spektrum | Wellenzahl (cm-1) Absorbance Units |
|---|---|
|
Adiantum raddianum
2920, 0.053 |
|
Alstroemeria aurea
2920, 0.053 |
|
Corylus avellana
2915, 0.012 |
|
Hippeastrum aulicum
2920, 0.038 |
|
Lilium speciosum
2920 |
|
Musa ornata
2920 |
|
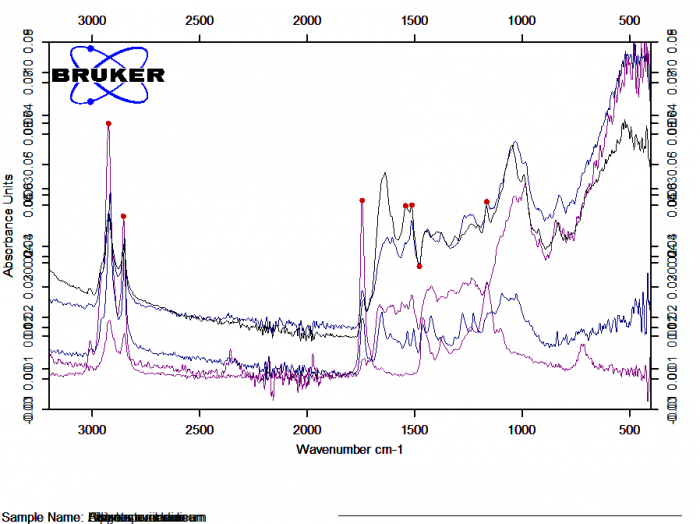
All in one
2920, Kohlenhydrate C-H |
Wichtige Peaks[Bearbeiten]
| Wellenzahl (cm_1) | [1][2][3] |
|---|---|
| 2920 | C-H stretching |
| 2850 | CH (Methoxy..) stretching |
| 1745 | C=O stretching |
| 1650-60 | Amide I |
| 1605 | Sporopollenin |
| 1550 | Amide II und Lignin |
| 1515 | Sporopollenin |
| 1462 | C=O stretching |
| 1410-1460 | Lipide und Proteine |
| 1171 | Sporopollenin |
| 970-1700 | Kohlenhydrate |
| 833 | Sporopollenin |
Literatur[Bearbeiten]
- ↑ Zimmermann B, Kohler A, Infrared Spectroscopy of Pollen Identifies Plant Species and Genus as Well as Environmental Conditions. PLoS ONE (2014): 9(4): e95417. doi:10.1371/journal.pone.0095417 [1]
- ↑ Dell'Anna R et al, Pollen discrimination and classification by Fourier transform infrared (FT-IR) microspectroscopy and machine learning, Anal Bioanal Chem (2009): Jul 394(5):1443-52. doi: 10.1007/s00216-009-2794-9. Epub 2009 Apr 25 [2]
- ↑ Ofelia A et al, Pollen composition discrimination by FTIR-ATR Spectroscopy, Conference Paper, Annual meeting of the International Honey Commission, OC5, Braganca, Portugal, September 2012 [3]
Stebler Th., FT-IR-Spektrum, In: Pollen-Wiki (01. Okt. 2024), https://pollen.tstebler.ch/MediaWiki/index.php?title=FT-IR-Spektrum .